Täglich bieten wir KOSTENLOSE lizenzierte Software an, die ihr sonst bezahlen müsstet!

Giveaway of the day — TrendingBot lite
TrendingBot lite war am 15. April 2009! als Giveaway verfügbar!
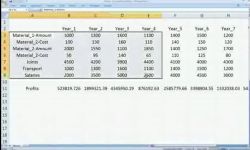
TrendingBot bietet eine Alternative zur konventionellen Datenanalyse-Software. Am Besten lässt sie sich mit Hilfe der Stichwörter "Gleichung-Sucher" oder "Trend Finder" beschreiben.
Die folgenden Funktionen gehören zu diesem innovativen Algorithmus:
- Beliebig detaillierte Kalkulationen (eine Minimalzahl an Simplifizierungen möglich).
- Keine Benutzer-Parameter.
- To-the-point Lösungen (direkt anwendbare Gleichung oder "Trend nicht gefunden").
TrendingBot litebeinhaltet die letzte Version des leistungsstarken TrendingBot-Algorithmus und hat keine zeitlichen Einschränkungen. Allerdings müsst ihr Folgendes beachten:
- Anzahl unabhängiger Variablen ist auf 5 begrenzt
- Kein voller Support/Kundenservice
- Keine Updates
Außerdem könnt ihr die TrendingBot Video-Anleitung herunterladen!
Bitte beachtet, dass TrendingBot lite extra für Giveaway Of The Day Besucher kreirt wurde und deswegen nicht auf der Hersteller-Seite verfügbar ist (Der Preis bezieht sich auf die Vollversion)
System-anforderungen:
Windows 2000, XP, 2003 Server, Vista; Microsoft Excel 2000, 2002, 2003, 2007; CPU: intel pentium 4 1.6 (2.2) GHz processor [or equivalent]; memory: 1 (2) GB; available hard disk space: 5 (10) GB
Herausgeber:
trendingITHomepage:
http://www.trendingit.com/index.htm?language=enDateigröße:
14.6 MB
Preis:
990 EUR
Kommentare zum TrendingBot lite
Please add a comment explaining the reason behind your vote.
This is not an excel macro. It is a really complex algorithm constructed on FORTRAN. Excel is just a rudimentary user-interface; an overall-compatible format to introduce data easily and quickly.
You have better videos on: http://www.youtube.com/trendingit
If you are more interested on possible uses, theoretical alternatives, etc., you can visit: http://www.wilmott.com/messageview.cfm?catid=34&threadid=69839
SPSS, SAS, and now TrendingBot are specialized software, and all three are expensive--for the data crunching it purports to do, the cost of 990 Euros is not at all outrageous.
Being a long-ago veteran of SPSS, trending software is analysis software--in our heads most of us struggle with understanding simple trends as soon as a second variable is introduced. Certainly adding a 4-5 variable analysis requires a computational effort, hence programs like this. For example. What was the reason for Obama to only win 53% in last November's election? Was it race? Was it the conservative message of fear? Was it elitism? And how did it change from September through November? Take the data and pull out the variables to test, and do the work.
This GAOTD offering of TrendingBot like many is designed for a niche market. What it does you cannot do with Excel alone, and would do in an hour what would literally take weeks by hand. If you do not have an interest or understanding of this niche, fine, don't comment. I don't comment on the dozens of multi-media tools and screensavers I have no interest in. For those who need it but have not yet been able to invest in the full version or in the equally costly SAS SPSS or other packages (just as obtuse to understand and use), this giveaway may be just the thing.
To the developers,
First, thanks for making the effort, bringing your tool to GAOTD.
Now, to practical matters, your tool is not intuitive to use and the accompanying movie is too fast to be followed and learn from the uses and capabilities of your tool.
Therefore, a help file with step-to-step instructions and examples could be helpful.
Best regards and again, thanks,
Gad
While it does concern me that the website and videos contain almost no information, and a forum link is a poor way to illustrate the features of a product, making the product available here on GOTD does give potential users a way to evaluate it.
As I don't have Excel installed and I haven't done much of this sort of thing since college, I'm not the right person to evaluate this product. However, it's a very crowded field, and this is an expensive product with a very limited focus. I've seen many packages over the years which could analyze data and automatically generate potentially complex mathematical models. You can get zillions of hits via Google, but be aware that analysis and modeling are different things. Here's a link to tons of free statistical software. The list has been kept updated, but many of the descriptions haven't. I tried a number of the links; they were all valid, and much of the software had been kept more-or-less updated.
Sorry about the OpenOffice issue but we are extremelly small and chose the most commonly used and compatibility-problems-free brand (Microsoft)


Der Trend geht zu völlig unnützer Software...
Otto-Normal User hat dafür mit sicherheit keine Verwendung und wird wohl kaum knappe 1000€ dafür hinlegen.
Benutzer die wissen was damit anzufangen ist, nennen sich vermutlich Statistiker und haben vermutlich andere Lösungen parat - und suchen vermutlich nicht bei GotD nach neuer Software.
Daher alle Daumen runter.
Save | Cancel
Das heutige Tool ist ein ausgezeichnetes Hilfsmittel bei der explorativen Datenanalyse! Die Lite-Version ist zwar auf 5 unabhängige Variablen beschränkt, aber auch bei einer größeren Variablenanzahl sollte es durch eine 5er Gruppierung möglich sein, die entscheidenden Einflussgrößen aufzuspüren.
Vielen Dank, GOTD, dass hier auch "nichtmassenkompatible" Software ihre Chance bekommt!
Save | Cancel
Das Video macht das Programm gleich viel verständlicher, oder doch nicht
Save | Cancel
Mein "aüßerst" sieht wirklich komisch aus - das kommt von zu viel Euphorie (oder Euforie)- bitte um Vergebung, es muss natürlich "äußerst" heißen.
Save | Cancel
ad. 6
Das Tool funktioniert auch mit Bahnhof - Fahrgastaufkommen, Taktfrequenz von S-Bahnen und InterRegios, Transportkapazität der Züge durch entsprechendes Nutzungsvolumen (Waggons) in Abhängigkeit des jährlichen Verkehrsaufkommens oder zur Planung desselben für saisonale Ereignisse (Ferienreisezeiten o.ä.). Das ist doch jetzt Bahnhof, oder? - Zieht Euch doch das flv-Video rein und let the Beast run, dann könnt Ihr erkennen, dass das nix mit irgend welchen Konvertern, PC-Tools oder Bildverschönerern zu tun hat, sondern eher was für Excel&Co.-Freaks ist, die auch Freude an komplexeren Aufgaben haben. Doch das ist bei GiveAway..-Besuchern doch nur ein verschwindend geringer Promillesatz - deshalb bin ich über dieses ..OfTheDay fürbaß erstaunt und aüßerst (positiv) überrascht. Mal was ganz etwas anderes für intelektuelle Exoten. Das ist viel besser als ein Bildschirmschoner ;)
Save | Cancel
Also ich seheh hier Spalten und Zeilen in die man etwas eintragen und ausrechnen kann. Das ist für mich wie Excel oder OpenOffice.
Save | Cancel
.Na da haben die schon wieder NICHT mitgedacht!
Kein MS Office 2007!
Nüscht für PRIVAT-Anwender!
Save | Cancel
Ich versteh nur bahnhof... wozu soll das gut sein?
Save | Cancel
Für den Privatgebrauch bestens geeignet, denn nun kann jeder an Hand mehrer durchzechten Nächte den mathematischen Zusammenhang zwischen den konsumierten Getränken, den Zigaretten, den Einfluss der Mitfeiernden in Abhängigkeit der jeweiligen Konsumiergeschwindigkeiten und der Häufigkeitsverteilung atypischer Feierverhaltensweise rechnerisch ermitteln und - damit künftig, mathematisch fundiert, seine Verhaltensweise für höchste Effektivität und beste Effizienz vorausberechnen - Irgendwo heißt das Design of Experiments (DoE) lol.
Save | Cancel
990 EUR?
Ihr habt sie doch nicht mehr alle …
@Bernadette:
>Ich sehe da schon im (unscharfen) Screamshot einen Error.
Ich sehe irgendwo irgendeinen Fehler, sag Euch aber nicht welchen. Dann kann das auch keiner nachprüfen und man muss mir glauben: Du bist zum Schreien d.... . ;O)
Save | Cancel
@Bernadette: "Scream"shot wird wohl stimmen. Einfach zum Schreien.
Vor allem: was fange ich mit diesem Wahnsinns-Tool überhaupt an? Vielleicht sollte ich den Trend bei der GotD-Software analysieren?
Save | Cancel
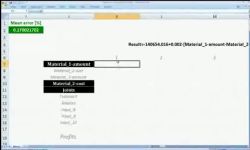
Ich sehe da schon im (unscharfen) Screamshot einen Error.
Na denn viel Spaß mit dem Tool! ;-)
Save | Cancel
990 EUR?
Ihr habt sie doch nicht mehr alle ...
Save | Cancel